Project Summary
Mass changes of ice sheets, glaciers, ice caps, land water hydrology, atmosphere, and ocean cause a non-uniform sea level rise due to the gravitational and self-attraction and loading effects, called sea level fingerprints (SLF). SLF have been previously derived from a combination of modeled and observed mass fluxes from the continents into the ocean. Here, we derive improved SLF from time series of time-variable gravity data from the GRACE mission for April 2002-October 2014. We evaluate the GRACE-derived SLF using Ocean Bottom Pressure (OBP) data from stations in the tropics, where OBP errors are the lowest. We detect the annual phase of the SLF in the OBP signal and separate it unambiguously from the barystatic sea level (BSL) at two stations. At the basin scale, the SLF explain a larger fraction of the variance in steric-corrected altimetry than the BSL, which has implications for evaluating mass transport between ocean basins.
Funding
This work was carried out at the UC Irvine and at the JPL-Caltech under research grants by NASA's Cryosphere, Interdisciplinary Science, Hydrology, and High Mountain Asia Programs.
Highlight
Detection of Sea Level Fingerprints (SLF) derived from GRACE gravity data using Ocean Bottom Pressure data in the tropics.
Comparison of SLF and steric-corrected altimetry reveals that the SLF have a significant impact on the estimation of ocean mass transport.
Study provides a road map for improved detection of SLF.
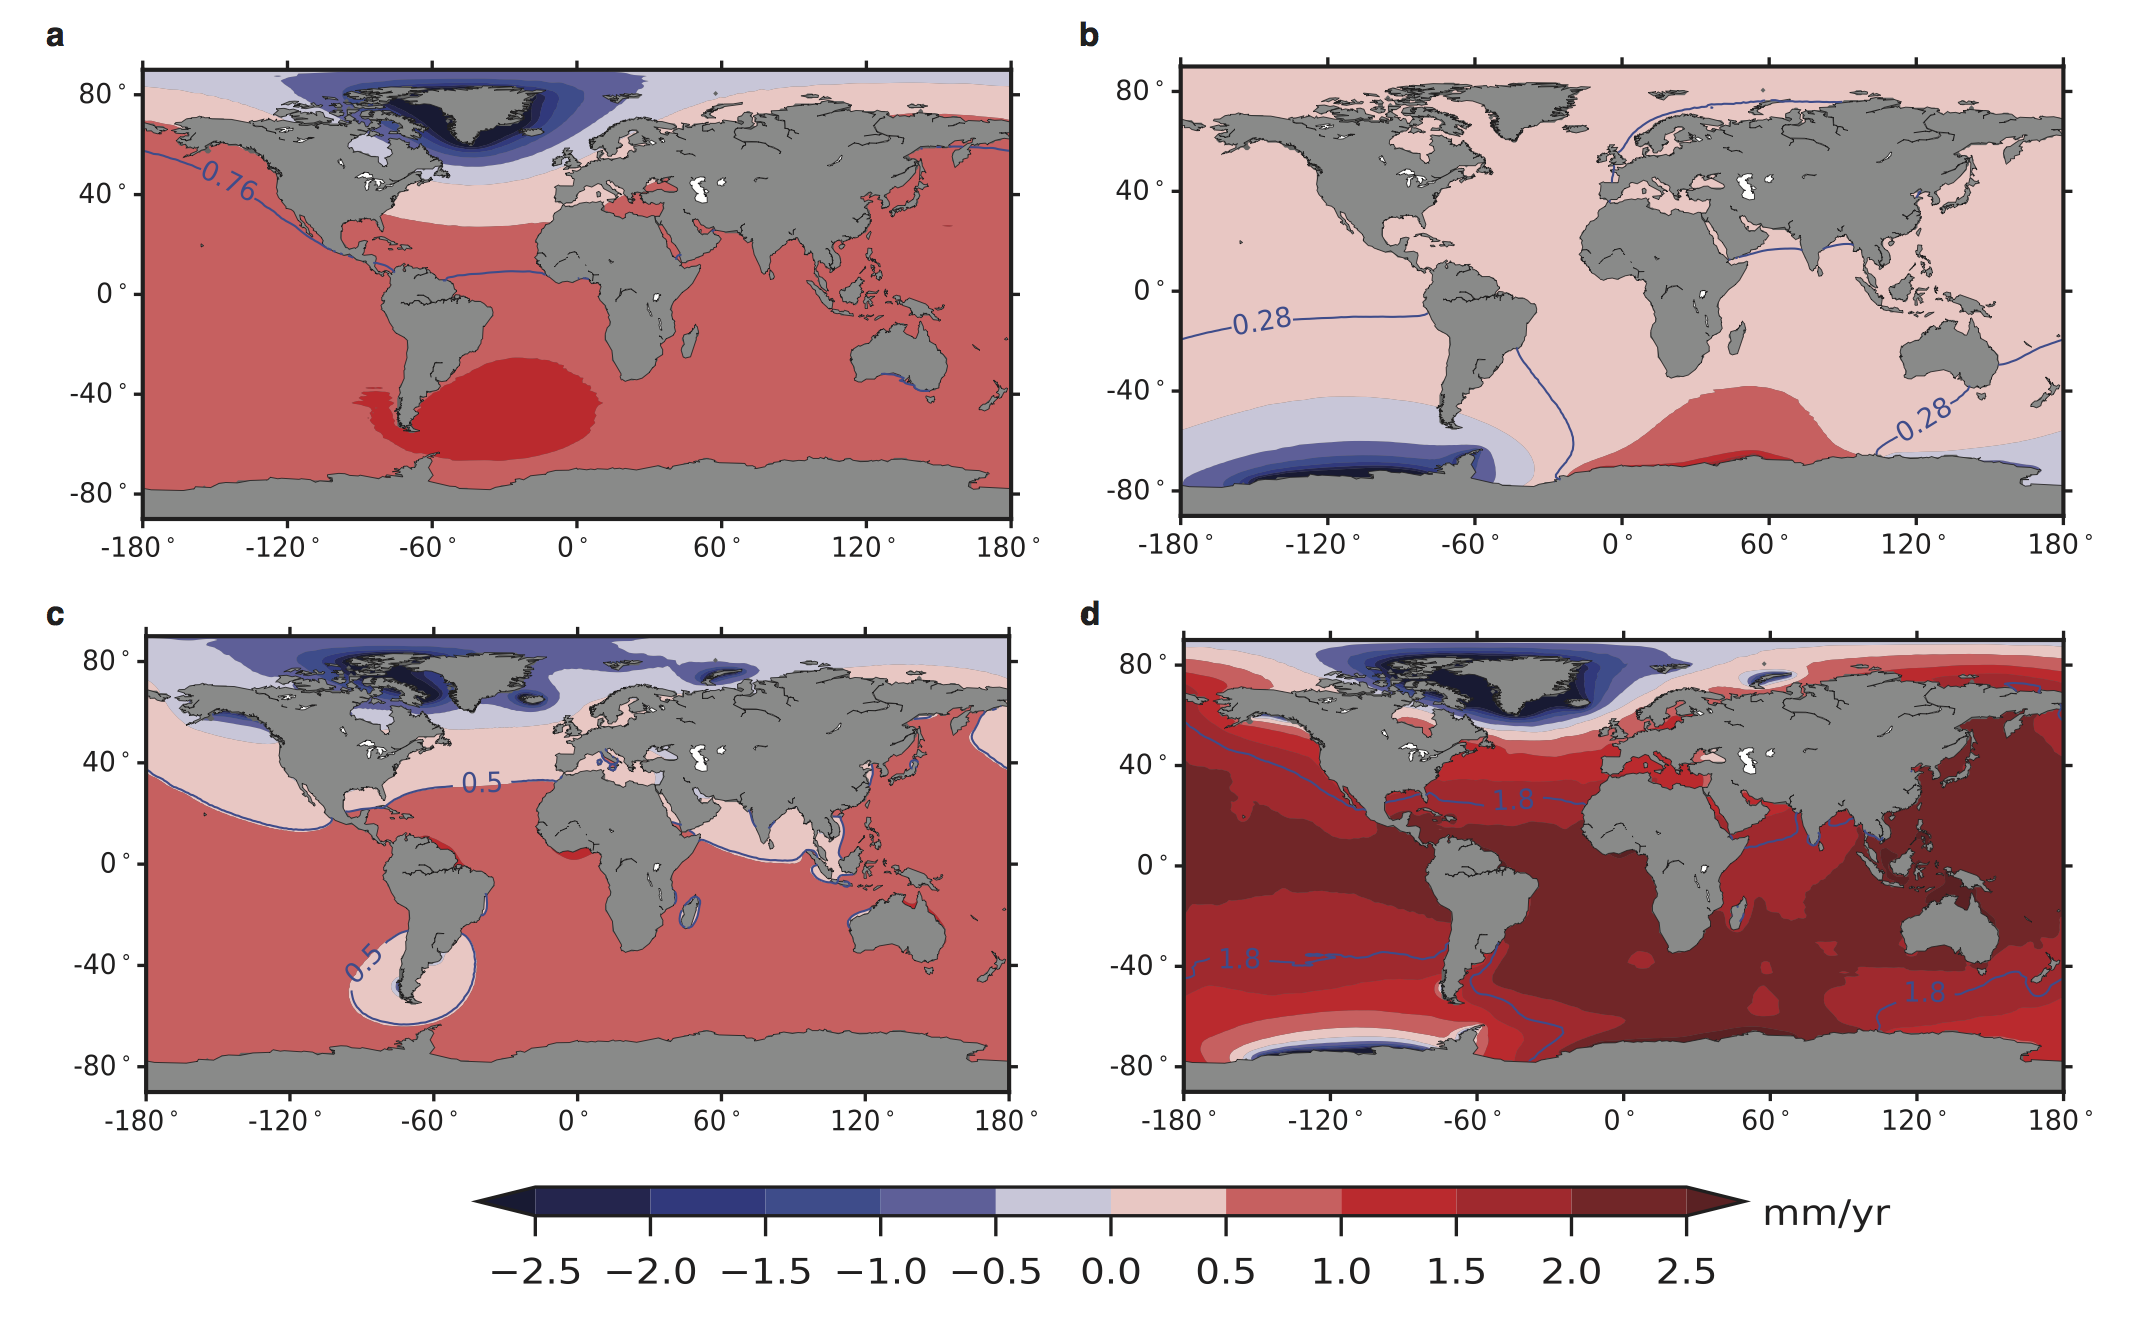
Figure 1 : Trends in the Sea Level Fingerprint (SLF) from (a) Greenland, (b) Antarctica, (c) land water storage including glaciers and ice caps, and (d) the sum of a, b, c, and atmospheric and non-tidal ocean loading (AOL). Trends are calculated for the time period April 2002-October 2014. Blue contour in (a-d) is the barystatic sea level (BSL) equivalent value.
Figure 2 : Time series of SLF (red), steric-corrected altimetry (blue), and barystatic sea level (green dotted in b-d) for (a) Near-global mean (60oS-66oN), (b) Atlantic, (c) Indian, and (d) Pacific Ocean basins during 2005-2013 with a 3-month smoothing applied to the basin averages in (b-d). (e) Cumulative time series relative to April 2002 of the contribution to BSL from Antarctica (blue), Greenland (black), land water mass and glaciers and ice caps (green dotted), atmospheric and non-tidal ocean loading (orange), and the sum of all four components (red) during 2002-2014. Best-fitted annual signal of static sea level from OBP measurements (blue), BSL (green dotted), and SLF (red) at (f) station 1 and (g) station 2. (h) Location of OBP stations 1-8 (white dots) superimposed on the phase of the annual SLF signal. Blue contour is the phase of the BSL.
Figure 3 : The sea level changes due to SLF of Greenland, Antarctica, land water storage including glaciers and ice caps, and atmospheric and non-tidal ocean loading (AOL) with respect to Jan 2013
Please Cite the paper below when using the provided dataset Citation:
Hsu, C.-W. and I. Velicogna, 2017: Detection of Sea Level Fingerprints derived from GRACE gravity data. Geophysical Research Letter.
Link to Data and Documentation:
* required field.
(Download link will be provided after entering your name and email so we can send out email notification to you if any data is updated. The OBP data are available upon request from J Williams (j.joll@noc.ac.uk))